How To Read Your Smart Meter

Smart Meters are part of the City of Tallahassee Utilities' Smart Grid, empowering you with optional programs, interactive tools and advanced technology to help you save energy, water and money. The digital display cycles through the following screens on a continual basis:
- Current Meter Reading
- On-Peak (Tier A) Reading*
- Off-Peak (Tier C) Reading*
- Network Registration Display
- Test Mode
- Current Time and Tier
*Applicable to optional rate plans only
See the samples below for more detailed information.
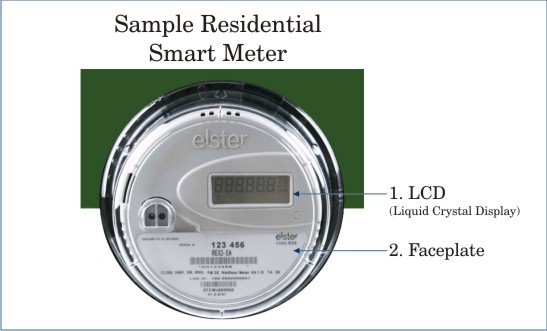
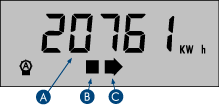
1. Current Meter Reading
This screen displays the total electricity (kWh) used since the meter was installed.
A. This number is your cumulative meter reading. To calculate your current electric usage, locate the electric reading (in kWh) on your previous utility bill. Subtract that number from the number on this screen to determine the kWh used to date in the current billing cycle.
B. This square flashes at a rate that reflects the amount of electricity currently being used. The faster it blinks, the more electricity is flowing into the home.
C. This arrow represents the direction of energy flow. A right-pointing arrow indicates energy flowing into the home. For customers with solar net metering, a left-pointing arrow indicates energy being returned to the City's electric grid.
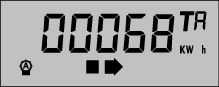
2. On-Peak (Tier A) Reading*
This screen displays the total On-Peak kWh used during Tier A. "TA" (in the upper right corner) denotes 7 a.m. to 7 p.m. on weekdays.
*Applicable to optional rate plans only
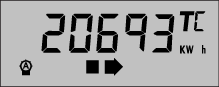
3. Off-Peak (Tier C) Reading*
This screen displays total kWh used during Tier C. "TC" denotes nights (7 p.m. to 7 a.m. on weekdays) and all day on weekends and holidays.
*Applicable to optional rate plans only
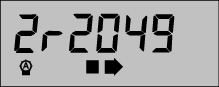
4. Network Registration Display
This screen displays information about the network.
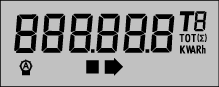
5. Test Mode
This screen appears as a test mode to verify all Smart Meter display screens and operational features.
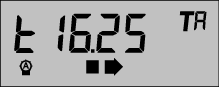
6. Current Time and Tier
This screen shows the current time (noted by "t" at left) in 24-hour format and the current Tier (TA or TC). Example: 16:25 (4:25 p.m.) during Tier A (On-Peak).